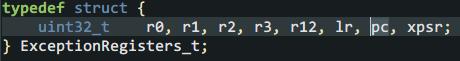
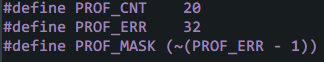
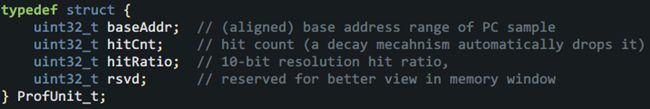
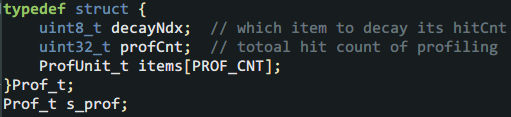
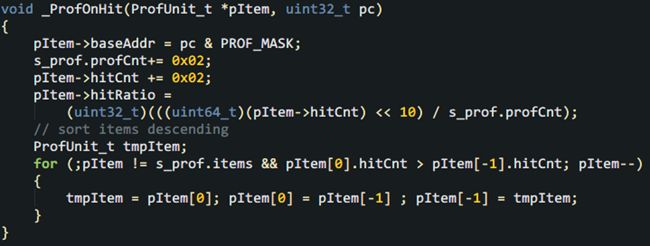
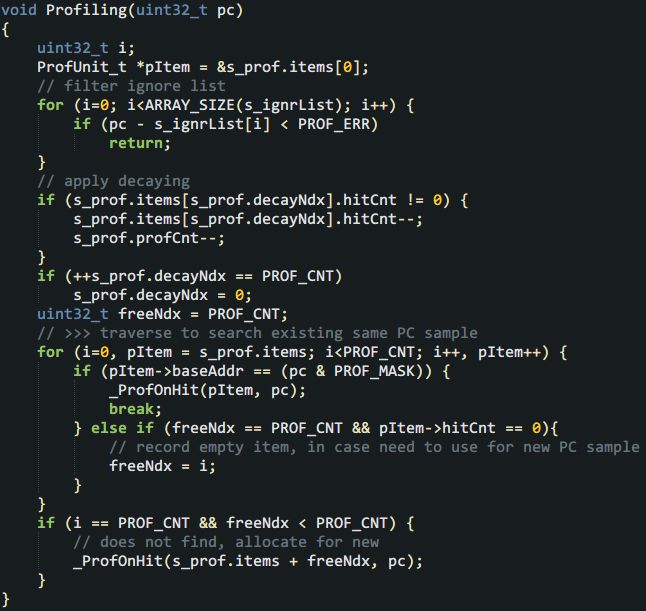
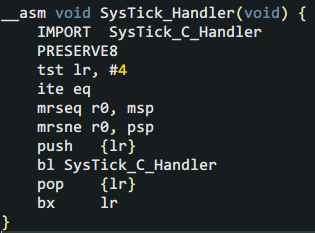
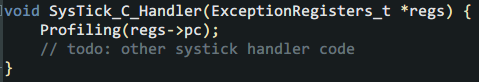
I'm not sure if you believe it or not, but the implementation is only 70 lines of code with braces, is it exciting? Closer to home, no matter how small the program is, it is also a data structure + code. Let's take a look at the core data structure from the outside and inside. First of all, since you want to collect the PC from the information that the Cortex-M core automatically pushes into the stack when responding to an interrupt, you must understand what is automatically pushed into the stack: It can be seen here that the Cortex-M core has automatically pressed 8 registers, and the humble pc on the second right is the protagonist. Friends who don’t know much about automatic stacking can check the introduction of Chapter 9 of the "Cortex-M3 Authoritative Guide" (Https://github.com/RockySong/cm3_def_guide_cn) In theory, pc can be any command position. Unfortunately, the number of instructions generated by general projects is often in the tens of thousands or even hundreds of thousands, should it be recorded? It is estimated that high-priced development tools will not do this. As the saying goes, "the first evil must be dealt with, and the association never asks." When we do profiling, there is no need to count the distribution density of the PC on all instructions, just grab a few big heads. Another trouble is that a function can have multiple instructions, the length of the function can vary greatly, and the coverage density of different areas in a large function is also different. Life still requires careful planning. We weigh the strike accuracy and ammunition consumption, and use two macros to determine the configuration, such as: The first macro PROF_CNT determines how many large heads are captured, and the second macro PROF_ERR determines the size of the mesh-the range of captured addresses (that is, the maximum error). Addresses in this range are counted as the same address block. Obviously, the more PROF_CNT and the smaller PROF_ERR, the more and more accurate the capture, which is closer to high-end analysis tools. It is worth noting that if PROF_ERR is small enough, you can capture the location that consumes more performance in a larger function. What the hell is the third macro PROF_MASK? This is actually a tool macro used to align the address down to the boundary of the error range. This also means that PROF_ERR must be an integer power of 2. This is to avoid performance-consuming modulo operations. Please list the key data structure below: PC statistical unit for performance analysis: Obviously, as much as PROF_CNT, there should be as many instances of ProfUnit_t. In the structure, hitCnt is the key parameter. It counts how many times the aligned PC address "baseAddr" has been collected, and "hitRatio" is a human-friendly auxiliary variable that provides thousand-point accuracy (in fact, 1024). CPU usage. In addition, there is a very useful little detail. For example, friends may have noticed that the CPU usage is also time-sensitive. Just like a long initialization may make some query-waiting functions extremely popular, but the more ups and downs before, the more silent the main body of the program runs, and there is even no chance to run it again. Even during normal operation, different functions are turned on at different times, and it often appears that "the emperor will take turns to do it and come to my house next year." Therefore, we can add a little bit of attenuation, that is, regularly deduct one square for non-zero hitCnt. If there is no follow-up continuous hits again, we will gradually go down the altar until it falls out of the rankings. This can improve the real-time performance of statistical results. The idea of ​​the attenuation mechanism is also very simple, that is, take turns from each PC sample point where hitCnt is not 0. Based on the above wishful thinking, the following structure governing the overall situation is defined: In this structure, decayNdx indicates who will deduct hitCnt from the next time the statistics are counted. After each deduction, it will be rotated to the next item to be fair and just. profCnt indicates how many profiling statistics have been done to calculate the hit rate, and items is the PC sample statistical unit introduced above. There is also a small detail here, that is, when applying attenuation to deduct the hitCnt of each item, profCnt also needs to be deducted. Okay, with a complete data structure, it's time to write code. From easy to difficult, we can first deal with the action on hit. The code is very simple, record the address, add hitCnt, calculate hitRate, and then "bubble" in real time to top the items with the most hitCnt. The purpose of sorting is also to highlight the key points and be friendly to humans. Here, hitCnt is increased by 2 each time, so that the decay does not increase too fast, and the "over-breathing" is slower. Friends can adjust the increase as needed. What's left is the most complex main function-it is less than 40 lines of code. First apply attenuation in the main function, and then check whether the PC sample this time has been recorded. If there is a record, call the above _ProfOnHit(), if there is no record, record this new PC sample on an item with hitCnt of 0, which also calls _ProfOnHit(). In addition, in order to avoid recording the idle function and some functions that you don't want to care about, the program also supports an "ignore list", and PC samples in the address range of the ignore list are ignored. That's it! The next step is to use it. It is very simple to use, just call Profiling() in the main body of the timer interrupt service routine and tell it the value of pc register when entering the timer interrupt. In order to get the PC into the stack, this requires a little basic knowledge of Cortex-M and handwritten assembly. The compilation entry under KEIL is given below: This small program first finds out the stack pointer used before interruption and passes it to the C language body "SysTick_C_Handler" as a parameter. If you don’t understand this compilation, just use it directly. The main usage of C language is as follows: When using it, we enter the debugging session of the development tool, let the program run for a while, and then stop. If you are in KEIL or IAR, you can use the memory window or watch window to observe s_prof.items. If GDB is used, you can enter the command p/a s_prof.items. Check the top-ranked item and compare the map file to estimate the name and approximate location of the function. It is worth mentioning that the function name corresponding to the address will be automatically parsed under GDB, so we don’t need to manually check the map, which is very intimate! Review the pits introduced in the theory article. When you find an unreasonable address, don’t get excited and see if it is one of the pits. If it is determined that it is not, it is necessary to deal with it in depth. At this point, the story of the theory and practice of the topic of performance analysis in this issue is finished. Wait, there seems to be something left unfinished. Just imagine, when we find out the functions that consume the most CPU resources one by one, if we are helpless, it will be futile. We must have a way to deal with them. One of the labor-saving and effective methods is to put them in a position with higher execution performance, which is the VIP area mentioned earlier. Next time, let's introduce the characteristics of various VIP areas and how to upgrade V! Stay tuned! Box Gun Bar(196) Box Gun Bar(196),Air Bar Max Puffs,Air Bar Max Puffs Vape,High Pro Max Puffs Bar KENNEDE ELECTRONICS MFG CO.,LTD. , https://www.axavape.com